Indiana ranks No. 1 for homebuilding and affordability
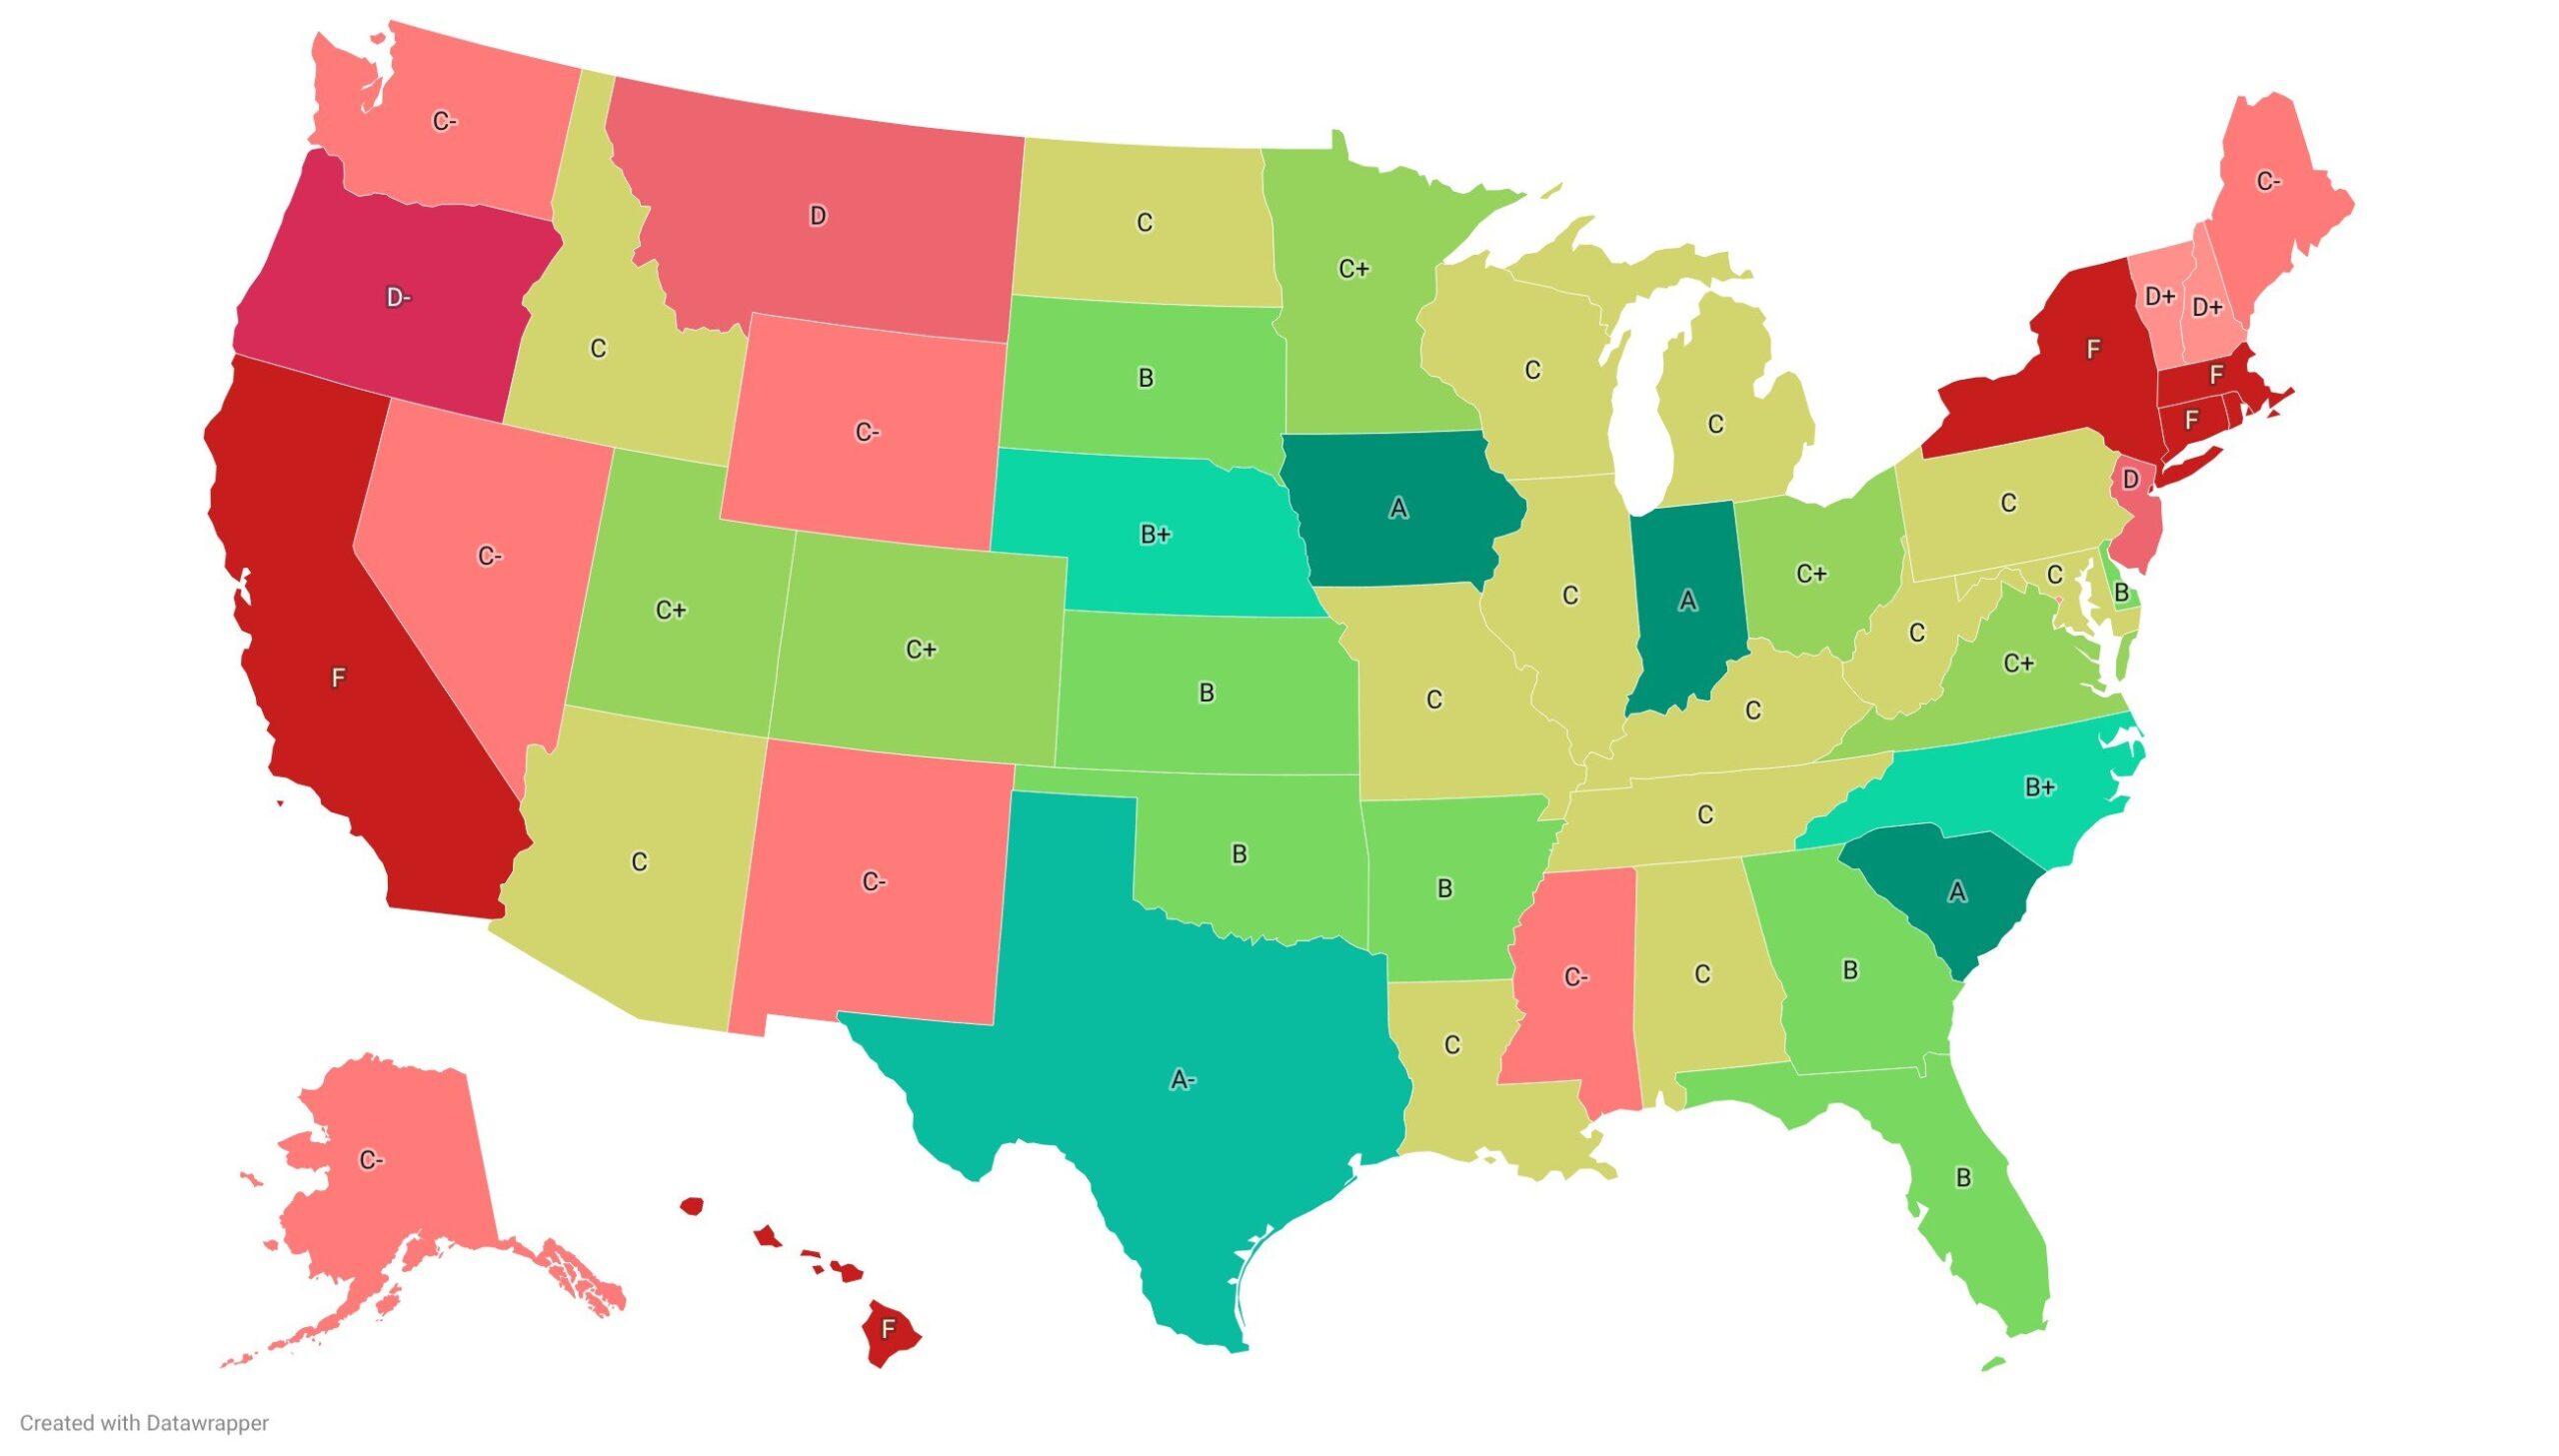
The Midwest and South continue to outpace the rest of the country in affordability and new construction, leaving nearly all coastal and western states far behind, according to the 2026 Realtor.com® Housing Report Cards.
“This year’s refresh reveals a familiar regional divide, but also some notable shifts beneath the surface, with a new state at the top of the class and a handful of states whose numbers have risen dramatically in both directions,” says Realtor.com’s senior economist. Joel Berner.
Indiana took the No. 1 ranking this year, moving up three spots from last year to earn an A grade and dethrone 2025 leader South Carolina, which fell to third.
In the fifty states and the District of Columbia, none received an A+ rating, a clear sign that even the strongest markets have room for improvement.
Notably, 12 of the 13 states that received the highest grades, ranging from B- to A, were all clustered in the Midwest and South. Delaware was the only state on the East Coast to crack the top 10, taking seventh place.
Following last year’s results, six coastal states earned an F grade, with New York at the bottom of the pile.
How the states are rated
All 50 states and DC are ranked on a 100-point scale based on two equally weighted core categories: housing affordability and homebuilding.
Affordability, which makes up half of the score, measures how accessible homeownership is for typical earners. It includes the REALTORS® Affordability Score and the portion of a state’s median household income needed to afford its average-priced home to calculate the financial burden on buyers.
The remaining 50% of the score is determined by housing activity, which assesses whether a state is producing enough new housing to meet demand. It is based on the permit/population ratio and the new construction premium – the price difference between purchasing a brand new home and an existing home.
Ready for something new?
Hoosier State takes the cake
Indiana tops the leaderboard with an overall score of 76.3 out of 100, winning thanks to its well-rounded scorecard, balancing formidable affordability with solid housing construction.
In the Hoosier State, a home with a median price of $295,810 requires roughly 28% of the median household income of $71,469, safely below the 30% affordability standard.
Additionally, the REALTORS® Affordability Score of 0.89 is among the highest in the US.
“In Indiana, I think we’ve been fortunate that, certainly in the long run, we’re seen as one of the more affordable places in the country to own a home,” Rik WajdaCEO of the Association of Indiana Builderstells Realtor.com. “We continue to try to minimize the regulatory costs of housing and what we can control at the state and local level.”
On the housing front, Indiana has performed well, if not spectacularly, with a permit-to-population ratio of 1.02. This means that the state has been issuing new housing permits at a rate roughly equivalent to its share of the national population.
Indiana built more than 20,000 single-family homes by 2025, a huge jump from about 12,000 a decade earlier. However, the pace of new construction is still insufficient to eliminate a huge historic deficit, amid an influx of young professionals flocking to the state from nearby markets like Chicago and Louisville, Kentucky, in search of greater affordability.
“That’s the challenge of putting upward pressure on many of our communities across the state in terms of pricing, because there just aren’t enough units in the ground for consumers to look at,” Wajda says.
He adds that the goal now is to produce more workers and starter homes to meet growing demand. To that end, the construction industry has pushed to cut through local red tape that governs minimum lot sizes, minimum square footage requirements, aesthetic standards and accessory dwelling units.
In April, the governor of Indiana Mike Braun signed into law Housing Bill 1001, aimed at lowering the cost of homeownership by rolling back restrictive local regulations.
“We have been fortunate to have a state government that understands the important role housing plays and the state’s economy,” said Wajda, whose organization lobbied for passage of the legislation. “We’ve had very strong leadership trying to grow the state’s economy and bring more jobs to the state.”
Wajda also credits the $50 million Residential Infrastructure Fund established in 2023 to help local communities expand the water, sewer and road networks needed to break ground on new developments.
“That has helped bring more housing into market areas that desperately needed it but may not have had the ability to expand infrastructure on their own,” he says.
Other high-performing states
Two other states earned straight A’s this year: Iowa held steady in second place and South Carolina fell to third.
According to Berner, Iowa continues to lead the U.S. in affordability, with the typical household there spending just over a quarter of its median income on paying for a median-priced home – the lowest share in all 50 states and DC.
Iowa’s two main weaknesses are its subdued permitting activity and its 56% new construction premium, which indicates builders are focusing on producing larger, more expensive homes rather than budget-friendly starter inventory.
Conversely, South Carolina issues nearly twice as many building permits as its population share suggests, while its new construction homes are 5.7% cheaper than existing homes, reflecting a construction industry attuned to buyers’ budgets.
Texas ranks fourth with an A grade and has maintained its position as the homebuilding champion. The country issues nearly 15% of all permits in the US, despite only having a 9.3% population share.
Where Texas fails, however, is affordability. A household earning a middle income here must set aside more than 32% of its income for an average-priced house, which puts it above the affordability standard.
North Carolina rounded out the top five for the second year in a row, earning a B+, thanks to a winning combination of robust permitting and new homes priced slightly lower than existing ones.
North Carolina’s biggest challenge lies in its lack of affordability, with a median-priced home consuming nearly 40% of the median household income.
Big climbers versus big fallers
The 2026 housing report card saw several dramatic shifts up and down the rankings. While aggressive construction pushed some unexpected markets to the top, sluggish construction activity and high prices caused former favorites to lose ground.
Delaware, America’s second-smallest state after Rhode Island, claimed the title of “most improved,” rising twelve spots to seventh with a B grade and a score of 66.1, thanks in large part to healthy licensing activity, supported by a high median income just south of $90,000, which helps buyers absorb higher housing costs.
Utah also moved up 12 spots from last year and ranks 17th with a C+ grade. The Western state’s success depends on its feverish pace of construction and exceptionally well-priced new homes. At the same time, affordability remains a challenge, with the average sales price approaching $590,000, consuming more than 42% of the average household income.
“One of the industry’s greatest strengths is its adaptability,” he says. Ross Fordexecutive officer of the Utah Home Builders Associationtells Realtor.com. “Builders are closely monitoring market conditions and changing consumer preferences and adapting their products accordingly. Whether it’s lot size, home design, amenities or price, successful builders understand that delivering the right product at the best possible price is essential.”
According to Ross, the biggest hurdle currently facing Utah’s housing market is the regulatory environment at the local level, with builders and developers often dealing with lengthy approval processes, uncertainty during project review and rising costs associated with obtaining permits.
“Every month a project is delayed increases costs, increases risk and ultimately impacts housing affordability,” the director warns. “If Utah wants to continue meeting housing demand, it will be critical to find ways to streamline approvals and improve predictability in the development process.”
Colorado and Kansas also stood out for their impressive upward mobility, moving up nine and seven spots respectively, but for different reasons. While pricey Colorado benefits most from its robust construction activity, Kansas’ secret weapon is its exceptional affordability.
At the other end of the spectrum, five states saw big declines from last year, with Alabama, Maryland and New Jersey each falling eight places, and Louisiana and Wisconsin seven, with lackluster permitting and construction activity emerging as the common denominators.
The bottom of the 2026 list looks painfully familiar, populated by coastal states crippled by a toxic mix of high demand, strict zoning, scarce land and slow permitting.
New York finished last, earning an F grade and a dismal score of just 8.5 out of 100, thanks to its stunningly poor affordability and bloodless construction activity.
Other flunkers include Massachusetts (No. 50), Rhode Island (No. 49), Hawaii (No. 48) and California (No. 47).
Receive real estate news in your inbox