Majority of 2026 FIFA World Cup host cities see double-digit increase in flight bookings | News
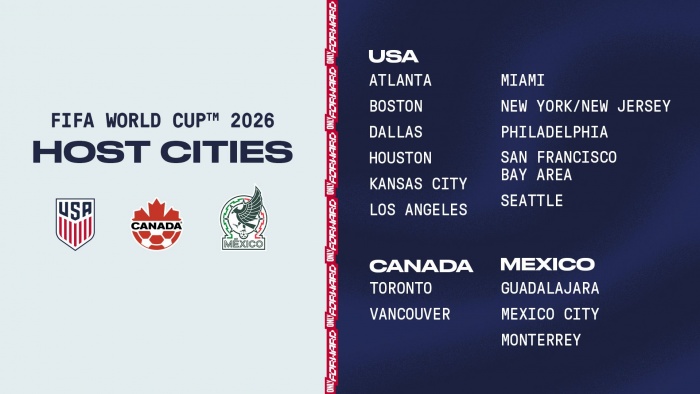
RateGain Travel Technologies Limited, a global leader in AI-powered SaaS solutions for the travel and hospitality industries, today launched the FIFA World Cup 2026 Market Pulse Dashboard, a first-of-its-kind free tool that gives travel brands continuous visibility into where travelers are going, how far in advance they are booking and which markets are driving demand across all 16 World Cup host cities in the US, Canada and Mexico.
Based on travel intent data from Sojern, the world’s largest of its kind and now part of RateGain, the data paints a more optimistic picture than recent media reporting suggests, showing sharp increases in real-time booking signals for flights and hotels. With the tournament less than two months away, it is spreading to host cities in the United States, Mexico and Canada.
“The FIFA World Cup is one of the most important demand events the global travel industry has seen in years and the brands that will win are the ones that act on real-time intelligence and don’t wait for the data to catch up,” said Bhanu Chopra, Founder and Managing Director of RateGain. “We’re making it available to everyone because the entire industry benefits when decisions are based on signals and not sentiment.”
“This is a fundamentally different kind of World Cup, spanning 16 host cities in three countries, and travel brands need to know exactly where their guests are coming from and where they are going,” said Mark Rabe, CEO of Sojern. “The Market Pulse Dashboard is built to answer that question in real time, so every hotel, destination and travel marketer can target smarter and capture demand as it grows.”
Looking specifically at the FIFA World Cup travel period (June 9 – July 18), the year-on-year growth in flight bookings at the host city level tells a similarly positive story:
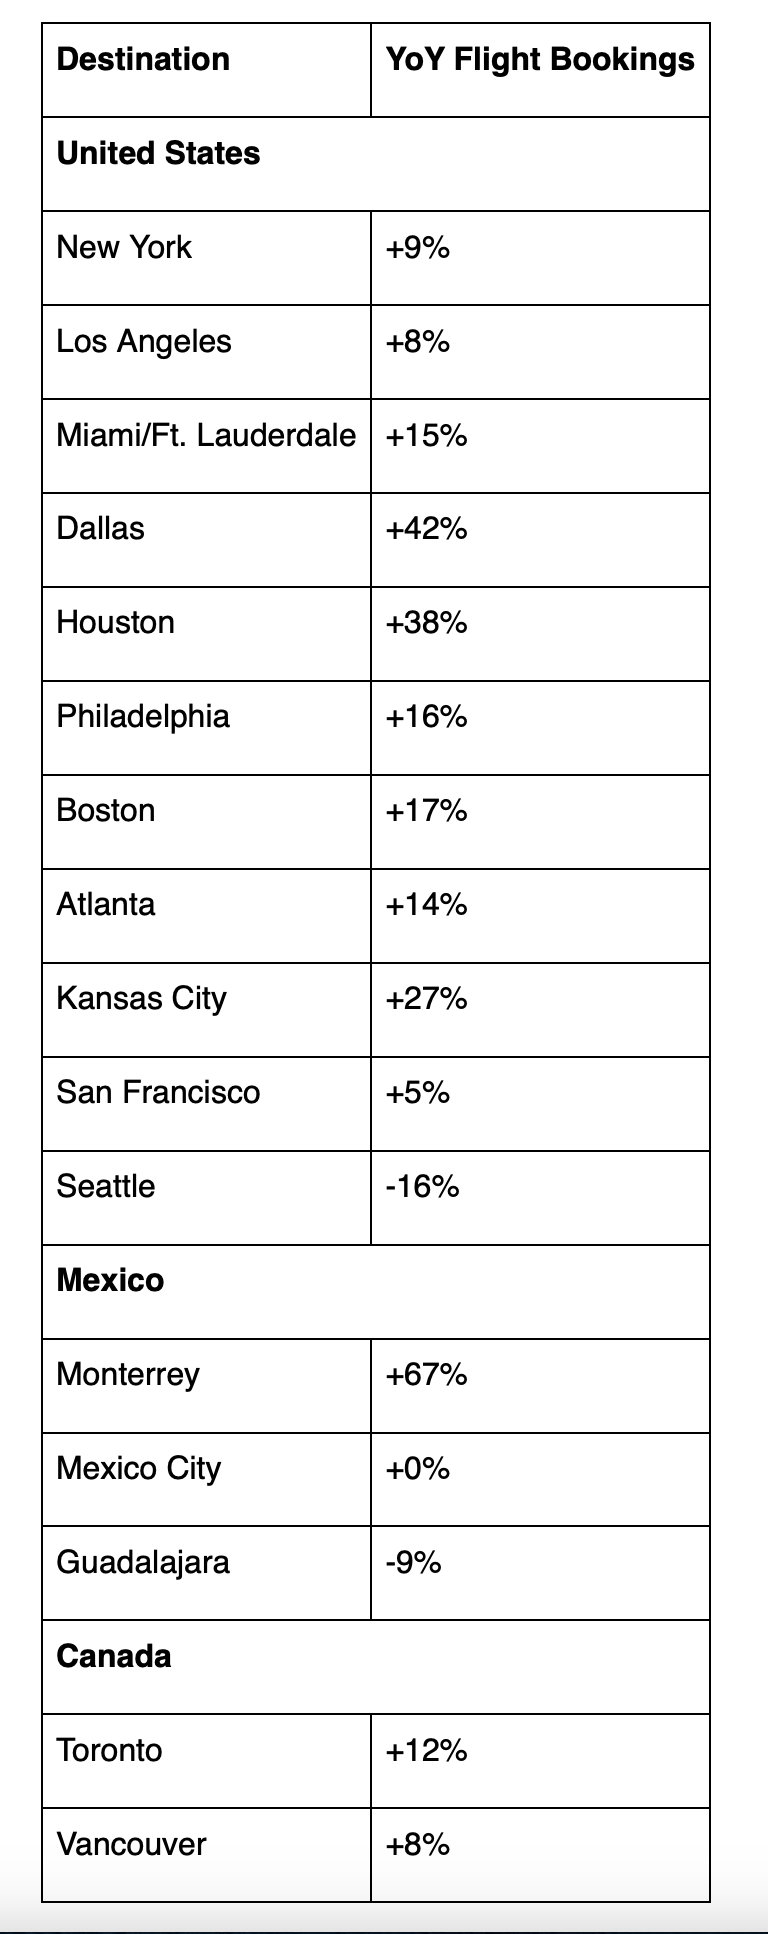
While market performance and some markets vary, the overall picture is one of positive momentum.
Who books and where they come from
The UK is the top international source market for flights to US host cities, accounting for 19.5% of international bookings, more than double the share of hotel bookings (8.5%), indicating that UK fans are booking their trips early. Canada accounts for another 18.4% of flight bookings.
Outside North America and Britain, the data reveals strong signals from further afield. South Korea is the third largest international source market with 4.1% of bookings, ahead of larger European markets including France (3.1%), Italy (2%) and Spain (2.1%). Japan shows a similar pattern, with 3.9% of flight bookings and a strong conversion to hotel bookings (4.7%), indicating high intent travelers.
From Latin America, data indicate significant untapped potential. Argentina – the defending World Cup champions – is responsible for only 1.3% of confirmed flight bookings, but 8.2% of flight searches, the largest gap between searches and bookings in the dataset, indicating substantial latent demand.
The European share of inbound demand to all World Cup destinations is growing year on year, from 12% to 14%, while APAC has increased, from 6% to 7%, reinforcing that long-haul demand remains resilient.
The broader context: headwinds are real, but so is the demand
Across all travel dates, global bookings for inbound flights to the US have remained modest compared to last year, down between -1% and -6% year-over-year for much of the past 9 to 10 months. This is consistent with broader industry reporting of softer inbound demand.
However, the momentum is now shifting: March 2026 has returned to growth (+2% y/y), and June 2026, the peak period of the World Cup, is already at +7%.
This turning point suggests the tournament is doing exactly what a mega-event should do: driving demand forward and reversing a softer period in inbound traffic.
Against this backdrop, the resilience of the World Cup bookings data is remarkable. Sports travelers tend to have higher intent, are less price sensitive and are more likely to pre-commit, making them a critical demand driver.
Booking patterns reinforce this trend, with 65% of World Cup travelers planning trips of 6 to 12+ days, indicating that the economic impact of these visits can be significant.
This is further reinforced by traveler profile data: almost half (48%) of those booking flights to World Cup destinations are traveling alone – a segment that typically books closer to departure. This suggests that a significant amount of demand is still likely to occur in the final weeks before the tournament, especially domestically.
Hotel question: The story is still being written
While the pace of hotel bookings has been the focus of recent commentary, accommodation bookings for major events typically lag flights by weeks or months. Historical patterns show significant volumes being confirmed in the last six to ten weeks before departure, meaning the current time frame is when demand should increase.
In New York, the most sought-after World Cup destination, booking trends are following expectations for an event of this magnitude.
With less than two months to go, Sojern’s data suggests the time for destinations and hotels to meet demand is now. The signal is clear: travelers are coming, and those who act on real-time intent data will be best placed to benefit.
About the dashboard
The dashboard is updated every 24 hours and tracks live flight and hotel booking signals as they evolve in the lead up to the tournament. This builds on RateGain’s scale in processing global demand signals across airlines, hotels and destinations. Built for travel marketers, revenue managers, DMOs and hospitality operators who need to make real-time decisions about pricing, inventory and campaign targeting, without delays in data availability. The dashboard is now live at fifa26marketpulse.rategain.com and can be accessed for free.
The dashboard gives brands a continuously updated picture of:
Flight and hotel booking trends in all 16 host cities in the US, Mexico and Canada
Source market breakdowns showing which countries demand comes from
Booking period trends that show how far in advance travelers commit
Tracking rating movements during the World Cup travel window
Demand growth signals by city, updated daily as new booking data comes in